Server Pay by State (2026): What Servers Really Make an Hour With Tips
Published
Quick answer: Servers in the U.S. made an average of $19.26 an hour with tips in May 2025, and half made $16.94 or more, according to the Bureau of Labor Statistics. Hawaii paid the most ($32.82 an hour), then Washington ($29.13), D.C. ($28.61) and Vermont ($28.29). Louisiana paid the least ($10.75), then Mississippi ($11.87) and Oklahoma ($12.44). Before tips, 16 states still let restaurants pay servers $2.13 an hour, while 7 require the full minimum wage.
Ask ten servers what the job pays and you'll get ten answers, most of them followed by “depends on the night.” True. But there is a real number behind the shrug. Every year the Bureau of Labor Statistics (BLS) surveys employers about what about 2.3 million waiters and waitresses earn, and its figures include tips. Put those next to what each state lets a restaurant pay you before tips, and you get a fairly honest map of where serving pays.
That's what this page is: the newest numbers for every state, two maps, the full table, and the fine print you need to read them properly.
Server pay by state at a glance
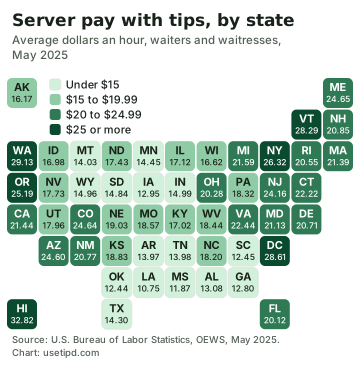
Nationally, servers averaged $19.26 an hour with tips. The median, the server right in the middle, made $16.94. The average sits higher because a smaller group of servers at busy, expensive restaurants pulls it up: the top tenth made $31.12 an hour or more.
The West Coast, the Northeast and Hawaii pay best. The Deep South pays least. That pattern isn't only about tips, as you'll see below. It's also about what the state makes the restaurant pay before a single guest leaves a dollar.
The highest and lowest paying states for servers
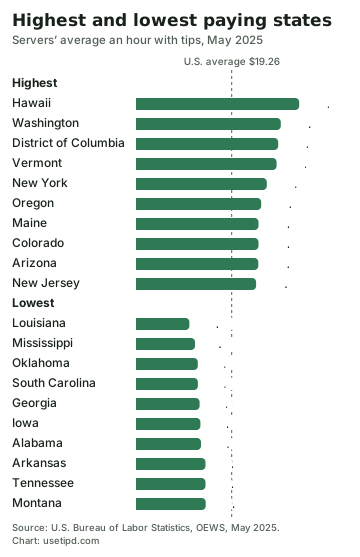
Hawaii is in a league of its own at $32.82 an hour, and its median is $29.99, so it isn't a handful of resort servers skewing the number. Tourists tip well, and Hawaii only lets restaurants knock $1.25 off the minimum wage for tips. Vermont is the surprise near the top: its median ($28.43) is actually higher than its average, which means pay there is unusually even from server to server.
At the bottom, Louisiana averages $10.75 and its median is exactly $7.25, the federal minimum wage. All ten of the lowest states except Montana let restaurants pay well under the minimum before tips. Keep reading before you conclude that New Orleans servers make $7.25, though: those low figures say as much about how tips get reported as about what servers take home.
What servers get paid before tips
Federal law lets a restaurant pay a tipped worker as little as $2.13 an hour in cash wages, as long as tips bring them up to the $7.25 federal minimum. The gap between the two, $5.12, is called the tip credit: the restaurant counts your tips toward its minimum wage bill. If your tips fall short in a week, the restaurant has to make up the difference. That rule has been in the Fair Labor Standards Act for decades and the $2.13 figure hasn't moved since 1991.
States can, and many do, require more.
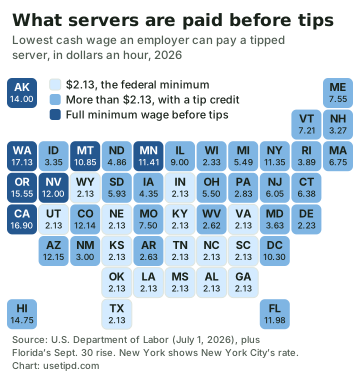
- The full minimum wage before tips (7 states): Alaska, California, Minnesota, Montana, Nevada, Oregon and Washington. No tip credit at all. In Washington that's $17.13 an hour before a single tip.
- More than $2.13, with a tip credit (27 states and D.C.): anywhere from Delaware's $2.23 to Hawaii's $14.75. Florida's rose to $11.98 on September 30, 2026, when its minimum wage reached $15.
- $2.13, the federal floor (16 states): Alabama, Georgia, Indiana, Kansas, Kentucky, Louisiana, Mississippi, Nebraska, North Carolina, Oklahoma, South Carolina, Tennessee, Texas, Utah, Virginia and Wyoming. Some of them have a higher minimum wage, like Nebraska at $15 and Virginia at $12.77, but still let restaurants pay servers $2.13 and count tips for the rest.
Does the tipped wage change what servers make?
Here's where the two datasets get interesting together. Group the states by their rule for pay before tips, weight each state by how many servers it has, and the difference is hard to miss:
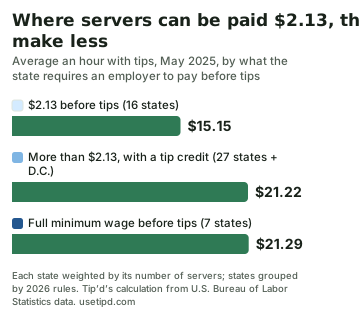
Servers in the $2.13 states averaged $15.15 an hour with tips. Everywhere else they averaged about $21.20, roughly $6 an hour more, which over a 30-hour week adds up to more than $9,000 a year.
Two honest cautions. First, this is a pattern, not proof: the $2.13 states also tend to have lower rents and lower wages across the board, so tipped-wage law isn't the only thing going on. Second, notice that requiring the full minimum wage (California, Washington and the rest) didn't come out far ahead of the middle group. Higher base pay hasn't meant lower take-home in those states, which is the argument you usually hear against it, but it hasn't meant a big jump either.
Every state: servers' pay with tips and before tips
All figures are dollars an hour. “Average” and “median with tips” come from May 2025, the newest BLS survey (published in May 2026). “Before tips” is the lowest cash wage a restaurant can pay a tipped server, and “minimum wage” the state’s minimum, both as of October 2026.
| State | Average with tips | Median with tips | Before tips | Minimum wage |
|---|---|---|---|---|
| Alabama | $13.08 | $12.91 | $2.13 | $7.25 |
| Alaska | $16.17 | $12.65 | $14.00 | $14.00 |
| Arizona | $24.60 | $21.13 | $12.15 | $15.15 |
| Arkansas | $13.97 | $11.86 | $2.63 | $11.00 |
| California | $21.44 | $17.35 | $16.90 | $16.90 |
| Colorado | $24.64 | $21.57 | $12.14 | $15.16 |
| Connecticut* | $22.22 | $18.16 | $6.38 | $16.94 |
| Delaware | $20.71 | $17.73 | $2.23 | $15.00 |
| District of Columbia | $28.61 | $23.01 | $10.30 | $18.40 |
| Florida* | $20.12 | $17.38 | $11.98 | $15.00 |
| Georgia | $12.80 | $8.99 | $2.13 | $7.25 |
| Hawaii | $32.82 | $29.99 | $14.75 | $16.00 |
| Idaho | $16.98 | $14.45 | $3.35 | $7.25 |
| Illinois | $17.12 | $15.00 | $9.00 | $15.00 |
| Indiana | $14.99 | $13.69 | $2.13 | $7.25 |
| Iowa | $12.95 | $10.10 | $4.35 | $7.25 |
| Kansas | $18.83 | $17.36 | $2.13 | $7.25 |
| Kentucky | $17.02 | $14.26 | $2.13 | $7.25 |
| Louisiana | $10.75 | $7.25 | $2.13 | $7.25 |
| Maine | $24.65 | $20.85 | $7.55 | $15.10 |
| Maryland | $21.13 | $17.67 | $3.63 | $15.00 |
| Massachusetts | $21.39 | $18.49 | $6.75 | $15.00 |
| Michigan | $21.59 | $18.16 | $5.49 | $13.73 |
| Minnesota | $14.45 | $12.25 | $11.41 | $11.41 |
| Mississippi | $11.87 | $10.27 | $2.13 | $7.25 |
| Missouri | $18.57 | $14.13 | $7.50 | $15.00 |
| Montana* | $14.03 | $11.23 | $10.85 | $10.85 |
| Nebraska | $19.03 | $16.24 | $2.13 | $15.00 |
| Nevada | $17.73 | $12.70 | $12.00 | $12.00 |
| New Hampshire | $20.85 | $18.48 | $3.27 | $7.25 |
| New Jersey | $24.16 | $21.62 | $6.05 | $15.92 |
| New Mexico | $20.77 | $17.75 | $3.00 | $12.00 |
| New York* | $26.32 | $22.61 | $11.35 | $17.00 |
| North Carolina | $18.20 | $15.46 | $2.13 | $7.25 |
| North Dakota | $17.43 | $14.85 | $4.86 | $7.25 |
| Ohio* | $20.28 | $17.65 | $5.50 | $11.00 |
| Oklahoma | $12.44 | $8.61 | $2.13 | $7.25 |
| Oregon* | $25.19 | $23.27 | $15.55 | $15.55 |
| Pennsylvania | $18.32 | $16.68 | $2.83 | $7.25 |
| Rhode Island | $20.55 | $17.03 | $3.89 | $16.00 |
| South Carolina | $12.45 | $8.83 | $2.13 | $7.25 |
| South Dakota | $14.84 | $13.94 | $5.93 | $11.85 |
| Tennessee | $13.98 | $13.35 | $2.13 | $7.25 |
| Texas | $14.30 | $11.18 | $2.13 | $7.25 |
| Utah | $17.96 | $14.98 | $2.13 | $7.25 |
| Vermont | $28.29 | $28.43 | $7.21 | $14.42 |
| Virginia | $22.44 | $21.52 | $2.13 | $12.77 |
| Washington | $29.13 | $26.98 | $17.13 | $17.13 |
| West Virginia | $18.44 | $17.01 | $2.62 | $8.75 |
| Wisconsin | $16.62 | $14.26 | $2.33 | $7.25 |
| Wyoming | $14.96 | $11.50 | $2.13 | $7.25 |
* Connecticut: restaurant and hotel servers; bartenders who usually get tips must be paid $8.23. Florida: rose to $15.00 and $11.98 on September 30, 2026. Montana: businesses with more than $110,000 a year in sales; a smaller business that federal law doesn't cover can pay $4.00. New York: food service workers in New York City, Long Island and Westchester; in the rest of the state it's $16.00 and $10.70. Ohio: employers with $405,000 or more in yearly sales. Oregon: the standard rate; the Portland area is $16.80 and rural counties $14.55, with no tip credit anywhere.
Alabama, Louisiana, Mississippi, South Carolina and Tennessee have no state minimum wage law, and Georgia's doesn't cover tipped workers, so the federal $7.25 and $2.13 apply there (the same goes for most restaurants in Kansas, Oklahoma, Texas, Utah and Wyoming). Some cities and counties set a higher minimum than their state. The table shows state rates.
Why your number is different
These are the best numbers anyone has for every state, and they're still not your paycheck. Four things to know before you compare yourself:
- They're what employers report. The BLS gets its figures from restaurants' payroll records. Card tips run through payroll; cash tips only count if they're reported. When Louisiana's median server shows exactly $7.25, that is very likely the guaranteed minimum on the books, not what servers there walk out with. Treat a low number as a floor.
- Averages hide the restaurant. A steakhouse server and a diner server in the same town can be $20 an hour apart. In Hawaii the bottom tenth of servers made $14.00 an hour and the top tenth $57.63.
- The yearly figure assumes a full-time year. The BLS also lists $40,060 a year for servers, but that's the hourly average times 2,080 hours. Plenty of servers work 25 or 30.
- They can't see your tip-outs. What you hand the bar and the bussers comes off your tips. Whether a restaurant's payroll shows your tips before or after that varies, so the survey can't tell you what you kept.
So the only hourly figure that really describes you is your own: everything you made in a shift (cash tips, card tips and your hourly pay) minus what you tipped out, divided by the hours you worked. A few weeks of that, and you'll know which nights, which section and which job are actually worth it.
That's the math Tip’d does for you. It's a tip tracker for iPhone: log a shift's hours, cash, card and tip-out in a few taps and it shows what you really made an hour, by job, by position and by night of the week. If you work two restaurants, it keeps them apart. Logging is free and your shifts stay in your own iCloud. Then you can hold your own number up against your state's in the table above.
Bartenders, hosts and bussers
The same survey covers the rest of the floor. Nationally, in May 2025:
| Job | Average an hour | Median an hour |
|---|---|---|
| Bartenders | $19.61 | $16.51 |
| Waiters and waitresses | $19.26 | $16.94 |
| Bussers and barbacks (dining room attendants and bartender helpers) | $16.46 | $16.34 |
| Hosts | $15.72 | $15.00 |
Bartenders edge out servers on average, while servers have the higher median. Hosts and bussers earn less but more evenly, since less of their pay depends on tips.
Questions people ask
How much do servers make an hour with tips?
$19.26 an hour on average in the U.S., and a median of $16.94, according to the Bureau of Labor Statistics' May 2025 survey. Both figures include tips that employers report.
Which state pays servers the most?
Hawaii, at $32.82 an hour on average with tips, followed by Washington ($29.13), the District of Columbia ($28.61) and Vermont ($28.29).
Which state pays servers the least?
Louisiana, at $10.75 an hour on average, followed by Mississippi ($11.87), Oklahoma ($12.44) and South Carolina ($12.45).
What's the lowest a restaurant can pay a server?
Under federal law, $2.13 an hour in cash wages, if tips bring the server to at least $7.25 an hour. If they don't, the employer has to pay the difference. Many states require more, and seven require the full minimum wage before tips.
Which states don't allow a tip credit?
Alaska, California, Minnesota, Montana, Nevada, Oregon and Washington. Servers there get the full state minimum wage before tips.
How much do servers make a year?
The BLS lists $40,060 a year on average, but that assumes 2,080 hours, a full-time year. A server working 30 hours a week at the national average would make about $30,000.
Do these numbers include tips?
Yes. The BLS counts tips as part of wages in this survey. It can only count tips that reach the employer's records, though, so cash tips that were never reported are missing.
Sources
- U.S. Bureau of Labor Statistics: May 2025 State Occupational Employment and Wage Estimates (occupation 35-3031, Waiters and Waitresses; data files on the OEWS tables page)
- BLS: Technical notes for the May 2025 OEWS estimates (“…and tips are included”)
- U.S. Department of Labor: Minimum Wages for Tipped Employees (revised July 1, 2026)
- U.S. Department of Labor: Fact Sheet #15, Tipped Employees Under the FLSA
- New York State Department of Labor: Minimum wage
- The Florida Constitution, Article X, Section 24 (Florida's minimum wage schedule)
- BLS Occupational Outlook Handbook: Waiters and Waitresses